Using SPSS for Statistics Assignment Help
Introduction about SPSS:
SPSS is one of the computer programs, which involves Assembly language the second level, general purpose of C language is the third level and the fourth level refers to program developed for specific purpose or Domain such as, SQL and SPSS (FOLDOC). The syntax of 4th level language is removed from the instructions executed by the computer and there are easy to use because of their syntax which is, often a resemble statements in human language. It is not necessary to be a SPSS Programmer to know what the program will do.
For Example:
|
GET FILE=‘data.sav’ SORT CASES by id. FREQUENCES VARIABLE = age sex race. |
History of SPSS:
SPSS was developed in late 1960’s by Norman H. Nie, C. Hadlai Hull and Dale H. Brent. Their purpose was to develop a software system based on the ideas of using statistics to turn raw data into information which is essential to ‘decision making’. SPSS is a statistical analysis package which was produced and sold by multinational companies. Earlier SPSS initials stood for Statistical Package for Social Science, where as today the market for SPSS has become much broader, now simply the name is used for Product and Company and not an acronym.
Development of SPSS:
Many Statistical computations involve sequences of simple arithmetic operations repeated over number of times. For example, the computation of a common statistics such as, Standard deviation is as follows:
- Determine the number of cases;
- Compute the sum of all observed values;
- Divide this sum by number of cases; as this gives the mean;
- For each case, compute the observed value minus mean;
- Computethe squares of these differences;
- Determine the sum of all squares;
- Divide this sum by number of observations minus 1;
- Find the root of the division result;
This is a useful exercise to perform computation by hand once or twice, to get same feel for statistics. But doing the arithmetic in situation involving a hundreds of cases would be a terrifying job.
The use of SPSS in Statistical research:
The research process:Many Scientists devised all sorts of schemes for better structuring the process of statistical research. A project starts with the formulation of the problem from which one or more testable hypothesis is derived. In order to test the hypothesis of has to collect the data which is subjected to Statistical Analysis.
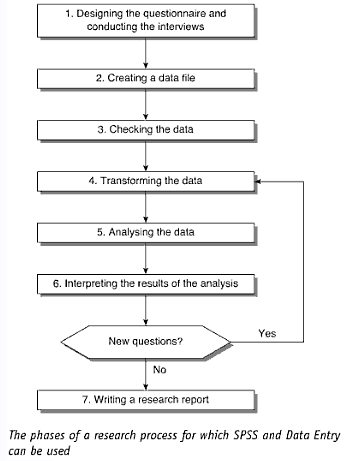
1.Designing the Questionnaire: After defining the issue on which the field study provides, a questionnaire is developed and conducted. The module data entry enables to present question and answers are in a well-organized form. Data entry can be automatically checked while entered. Skip questions that are not relevant for respondent and, where needed, recode the data.
2.Creating the data: SPSS can import data files created with various database (for eg. Access) spreadsheet packages.
3.Checking the data: After the data has been entered or converted has to be checked. Using the module data entry has the option to automatically check the data during the input process.
4.Transferring the data: This is only needed when not all the original data are to be used in the analysis. Transforming may involve the following operations:
(a)Variables: Transforming variables are grouping values into categories or computing the new variables.
(b)Cases: Transforming the cases involves selecting a group of cases or sorting the data.
(c)Entire data File: Transforming the entire data file means merging multiple data files or transposing a data file.
5.Analysis of data: This is the fifth step in the research process is performed by the actual statistical analysis.As, SPSS consists of a base module plus a number of add-on modules. This analytical techniques detailed can becategorized into the following six groups:
1.Describing variables: This analysis helps the researcher to understand the nature of data, which is useful for determining the subsequent analysis. A variable may be described in terms of the following:
(a)The Frequency of each value: The frequency of each value, determining the frequencies of values is nothing more than counting their occurrence. The frequencies can be summarized in a table for which SPSS has the Frequencies command.
(b)The central tendency: The central tendency refers to a average group of cases. The following statistics are used:
1.The mode: The value with the highest frequency is used for nominal variables in particular.
2.The median: The value corresponding to the middle most case when cases are sorted in ascending or descending order, these are used for ordinal variable in particular.
3.The mean: The sum of all cases divided by number of cases, these are used for interval variables and ratio variables in particular.
(c)The dispersion(the extent of variation)
(d)The fit with a theoretical distribution
(e)They tend in the data (time series)
6.Describing group of cases: To describe the group of cases one can depend on the measurement level of the variable. One of the following technique is applied:
·A cross table contains information on the number or percentage of cases in the various groups. Cross tables are used mainly for nominal and ordinal variables.
·For interval variables or the ratio variables the means command is used to request the statistics for each group such as the mean, the dispersion and the number of cases.
Testing the differences between independent groups:
SPSS can do several tests to determine whether independent groups differ significantly from each other.It is customary to distinguish between situations with two groups and three or more groups.
Testing differences between related groups:
Sometimes the cases in the different groups are not independent, but in some way related to each other.
Determining the relationship between two variables:
To use determining the two variables as follows:
·A cross table for nominal and ordinal variable, requested with the cross table command.
·A scatter plot in which one variable is plotted horizontal axis and other one on the vertical axis. Scatter plots are made with the Graphs Chart Builder command.
The extent to which two variables are related can also be expressed in the form of a statistic.
For more details you can visit our website at https://www.helpwithassignment.com/statistics-assignment-help and http://www.helpwiththesis.com
This article is in continuation with our previous articles on Statistics which include Hypothesis Testing, Regression, Correlation, SPSS Statistics Help
Book Your Assignment
Recent Posts

How To Prepare An Excellent Thesis Defense?
Read More
How to Restate A Thesis? – A Detailed Guide
Read More
Explanatory Thesis: Examples and Guide for Clear Writing
Read More
How To Write 3 Types Of Thesis Statements?
Read More
How to Effectively Prepare for Your Thesis Defense?
Read MoreGet assignment help from subject matter experts!
4.7/5 rating | 10,000+ happy students | Great tutors 24/7