- Home
- About Us
- Services
- Online Assignment Help
- Auditing Assignment Help Service
- Nursing Assignment Help
- Excel Assignment Help
- Advanced Economics Homework Help
- XML Assignment Help
- Strategic Management Assignment Help
- Logarithm Assignment Help
- Probability Assignment Help
- Matrices Assignment Help
- Commercial Bank Management
- Thesis Proposal Help
- Corporate Strategy
- Electrical Engineering
- Civil engineering
- Mechanical Engineering
- Electronics Engineering
- Financial Plan Development
- Research Paper
- Political Science Assignment Help
- Operations Management Assignment Help
- Computer Vision Assignment Help
- Commercial Bank Management
- IT Security Assignment Help
- College Essay Help
- Term Paper Help
- Medical Science Assignment Help
- Nursing Thesis Writing Help
- Religion
- Thesis Help
- Supply Chain Management Assignment Help
- Australia Assignment Help
- Cause and Effect Essay
- International Finance Assignment Help
- Statistics Assignment Help
- Computer Science
- Information Technology
- Bioinformatics Assignment Help
- Biostatistics Assignment Help
- Excel Assignment Help
- Taxation
- Research Proposal Help
- SAASU Assignment Help
- Auditing Assignment Help Service
- Workplace Learning in Finance
- Dissertation & Homework Help
- Custom Essay Writing Help
- Online Assignment Help
- Reviews
- Tutors
Publish On: February 11, 2011
By HelpWithAssignment
Understanding Central Tendency Properties (Mean, Median and Mode) in Statistics
-

Conquer Deadlines with Expert Help
-
1M+ Happy Students
-
11+yr Legacy
Rated #1
Provider for the last 10 successive years
99109+
Assignments delivered. 543 + , just today
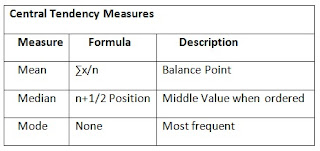
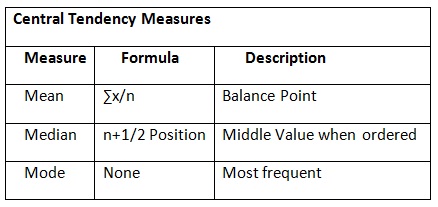
In Statistics, Measures of Central Tendency are numerical values that locate, in some sense, the centre of a set of data. The term average is often associated with all measures of central tendency.
Mean
1. Measure of central tendency
2. Most common measure
3. Acts as ‘balance point’
4. Affected by extreme values (‘outliers’)
5. Formula (sample mean)
Raw Data: 10.3 4.9 8.9 11.7 6.3 7.7
X = ∑ x/n = x1 + x2 + x3 …..xn /n
Here in this case 10.3+ 4.9+ 8.9 + 11.7 +6.3 + 7.7/6 = 8.3
The mean is 8.3
Median
1. Measure of central tendency
2. Middle value in ordered sequence
• If n is odd, middle value of sequence
• If n is even, average of 2 middle values
3. Position of median in sequence
Positioning Point = n+1/2
4. Not affected by extreme values
Calculating Median from an Odd-sized example
• Raw Data: 24.1 22.6 21.5 23.7 22.6
• Ordered: 21.5 22.6 22.6 23.7 24.1
• Position: 1 2 3 4 5
Positioning Point = n+1/2 = 5+1/2 = 3
Median = 22.6
Median Example from an Even-Sized Sample
• Raw Data: 10.3 4.9 8.9 11.7 6.3 7.7
• Ordered: 4.9 6.3 7.7 8.9 10.3 11.7
• Position: 1 2 3 4 5 6
Positioning Point = n+1/2 = 6+1/2 = 3.5
Median = 7.7 + 8.9/2 = 8.3
Mode
1. Measure of central tendency
2. Value that occurs most often
3. Not affected by extreme values
4. May be no mode or several modes
5. May be used for quantitative or qualitative data
• No Mode
Raw Data: 10.3 4.9 8.9 11.7 6.3 7.7
• One Mode
Raw Data: 6.3 4.9 8.9 6.3 4.9 4.9
• More Than 1 Mode
Raw Data: 21 28 28 41 43 43
Say, if you’re a financial analyst for Prudential-Bache Securities. You have collected the following closing stock prices of new stock issues: 17, 16, 21, 18, 13, 16, 12, 11.
Describe the stock prices in terms of central tendency.
Central Tendency Solution
Mean
X = ∑x/n = 17 + 16 + 21 + 18 + 13 + 16 + 12 + 11/8 = 15.5
Median
• Raw Data: 17 16 21 18 13 16 12 11
• Ordered: 11 12 13 16 16 17 18 21
• Position: 1 2 3 4 5 6 7 8
Positioning Point = n+1/2 = 8+1/2 = 4.5
Median = 16+16/2 = 16
Mode
Raw Data: 17, 16, 21, 18, 13, 16, 12, 11
Mode = 16
At HelpWithAssignment.com we provide best quality Assignment help, Homework help, Online Tutoring and Thesis and Dissertation help as well. For any of the above services you can contact us at https://www.helpwithassignment.com/ and
https://www.helpwithassignment.com/statistics-assignment-help
This article is in continuation with our previous article on Statistics (Regression), Statistics (Correlation), Statistics (Hypothesis Testing), Statistics Assignment help
To take advantage of our reliable research paper writing service, simply fill out the order form with your requirements. We will deliver a well-researched academic paper tailored to your specifications at a fair price while ensuring timely delivery. Our service is known for providing top-scoring, plagiarism-free research papers. Additionally, we offer unlimited revisions and 24/7 customer support as part of our commitment to quality.
So, don’t hesitate—place your order today and receive expert academic assistance instantly!